Tuesday 30 April 2019

Data±Geo London : Spatial Analysis and Geo prediction

Geo-Data London by CDRC dated 30th April at Pearson building 

AGI - Association for geographic information by Paul , intelligence@london.gov.uk from the London datastore.Paul Hodgson is GIS & Infrastructure Manager at Greater London Authority, holds an MSc in GISc (Birbeck 2003), and is a Chartered Geographer (GIS). Cleaning up London’s air - number of awareness of air quality, energy for London, inclusion and integration and citizen science. In 1952- poor quality of air in London. Why is the quality poor - health - priority pollutants NO2 and small particulates which is related to chronic health problems. The major solutions is over 90% of major roads in the inner london exceeded its NO2 limits. Introduction of electric vehicles with new vehicles introduced. High spatial resolution with annual average values, 2016 data just released that will allow us to explore scenarios and pyritise intervention ares and monitor legal boundaries. The probabilistic modelling with ATI team, ingests data of different resolution, assess different ML approaches. There are connecting data with different aspects like TFL, GLA, central government , London boroughs, academic institutions, business, LfB, Charities etc as the mayor of London 

Thomas Heinis form Imperial - Large scale spatial analytics for road space optimisation  b y Space Lab. Spatial data information about the locations and shapes of geographic features and relationships between them stored in coordinates and topology. Mapped stat data, GPS records, points of interests, junction and road segments with explosion and trajectories wit the prevalence of mobile devices. Developing stable algorithmic tools for analysis on big spatial data which has spots and regions in scalable way, Building block that is hottest spot search where the worst congestion spot in London is calibrated and dense location is proposed with MaxRS. With help of Naive approach a evaluation aggregation of every location with infinite number of locations. 


Thursday 11 April 2019

Mapping the linguistic landscape of Helsinki, Finland using social media data

Mapping the linguistic landscape of Helsinki, Finland using social media data
Social media and digital footprints in urban space at Pearson building , Department of geography UCL dated 11th April 2019


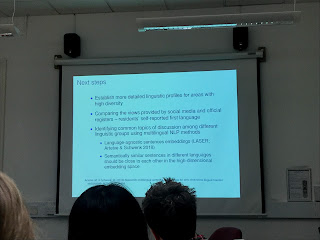
Physical and virtual spaces - satellite positioning technology and location information connect. The resulting ‘double space’ also encompasses the physical data. The tracking temporal changes has been closed via instagram API uploaded on Instagram between July 2013- Feb 2018.  Instagram aggregate all the place name in different direction. The API allows to POI_ points of interests on the platform. The graph shows the tourist and public event is seen on the data and pattern is created yearly for 2018. The growing number in unique users is seen with lot of data to detect the automatic language identification. There is lots of variation in standard forms. There are three different algorithm developed by Google for the browser, CLD2 and fastText are the libraries with Landig.py. Evaluating using the gold standard that is Krippendorff’s alpha - 0.929. The results improves if its characteristics is changed to get good accuracy. It is interesting but not surprising is that facebook have created good algorithm to read different language which have linguistic meanings. Measuring and quantifying the linguistic language with its diversity developed in ecology and information science. Temporal changes in the virtual linguistic landscape which have third order polynomial regression. Japanese and Korean has increased with Swedish being the second official language where English being first language. Dominance or the proportion of the dominant language is decreasing with Shannon entropy used to describe the language kind of thinking which is very interesting. Unique languages in the metropolitan area 

Friday 5 April 2019

Visualisation in Big Sense

Visualisation Literacy : Improving Assessment by David Concannon dated 5th April 2019 at UCL Bartlett CASA room PhD upgrade seminar

Data being the main ability to work and increase its important in decision making. The data is represented with help of visualisation  with the ability of data set and content. Visualisation literacy is defined as the ability and skill to read and interpret visually represented data in and to extract information from data visualisations. If a user cannot confidently use visualisation to understand the information it represents, the visualisation does not work and denies an individual the ability to participate in our increasingly data-driven world. We risk increasing the digital divide already evident in our society. Therefore, it is essential to that information visualisation literacy into account in to ensure users can successfully understand data.

Thursday 4 April 2019

Data Science Modelling in Fintech

IWOCA gave a presentation on Data Science Modelling in Fintech
Data with customer were repeated in each day with price on the door which was repeated in every row which also included as a co-variable. The data format have been correlated which is represented with interaction with Time. To start with the approval period to have interaction with time and trade with other covariation. The other funded column which is binary is a dependent variable , it is important to note that it stops when the event has occurred hence we need to apply regression model on the simulated data which is generated model presented on the fitted model data. In practise the time in funding is censored at the present day which is yet to be happened. 

Tuesday 2 April 2019

Digital Technology for improving productivity in food manufacturing

Digital technology at Loughborough University London at Here East, Queens Park dated 2nd April 2019
IN smart food factory the information will flow up and down the supply chain. There is technology already exit to build the smart food factory. Smart machine which is mapping their own needs. There are producing to forecast to create the products on the warehouse so that it is stored in the place so that we could finalise the label to be fixed. One of the obstacle is worried IOT solutions. 
 The venture capital- lots of digital projects around like vertical frame etc, the fundamental point is that these project to be successful needs a mind set with innovation of digital which needs to be ten times better than the existing projects.
When the project exist there is lower risk compared to the digital age which is much more substantial with the nature of project needs to be addressed. It's not only instrumental process need a mind set in the digital environment.

Monday 1 April 2019

Smart way to Industry by IOT Solutions

Smart way to Industry by IOT Solutions

Profibus and Prominent International(PI UK) and Incase organised session in The Crystal - Siemens Sustainable cities in London

 The exhibition space by Siemens presents the internet of solutions , adding to the sustainable solutions with use of free infrastructure. The complete space was build with nested roof plantation and water was reused in the landscape of the building.
 Overall, it was a sustainable cities that was created as a prototype and a major success for the development of the project.


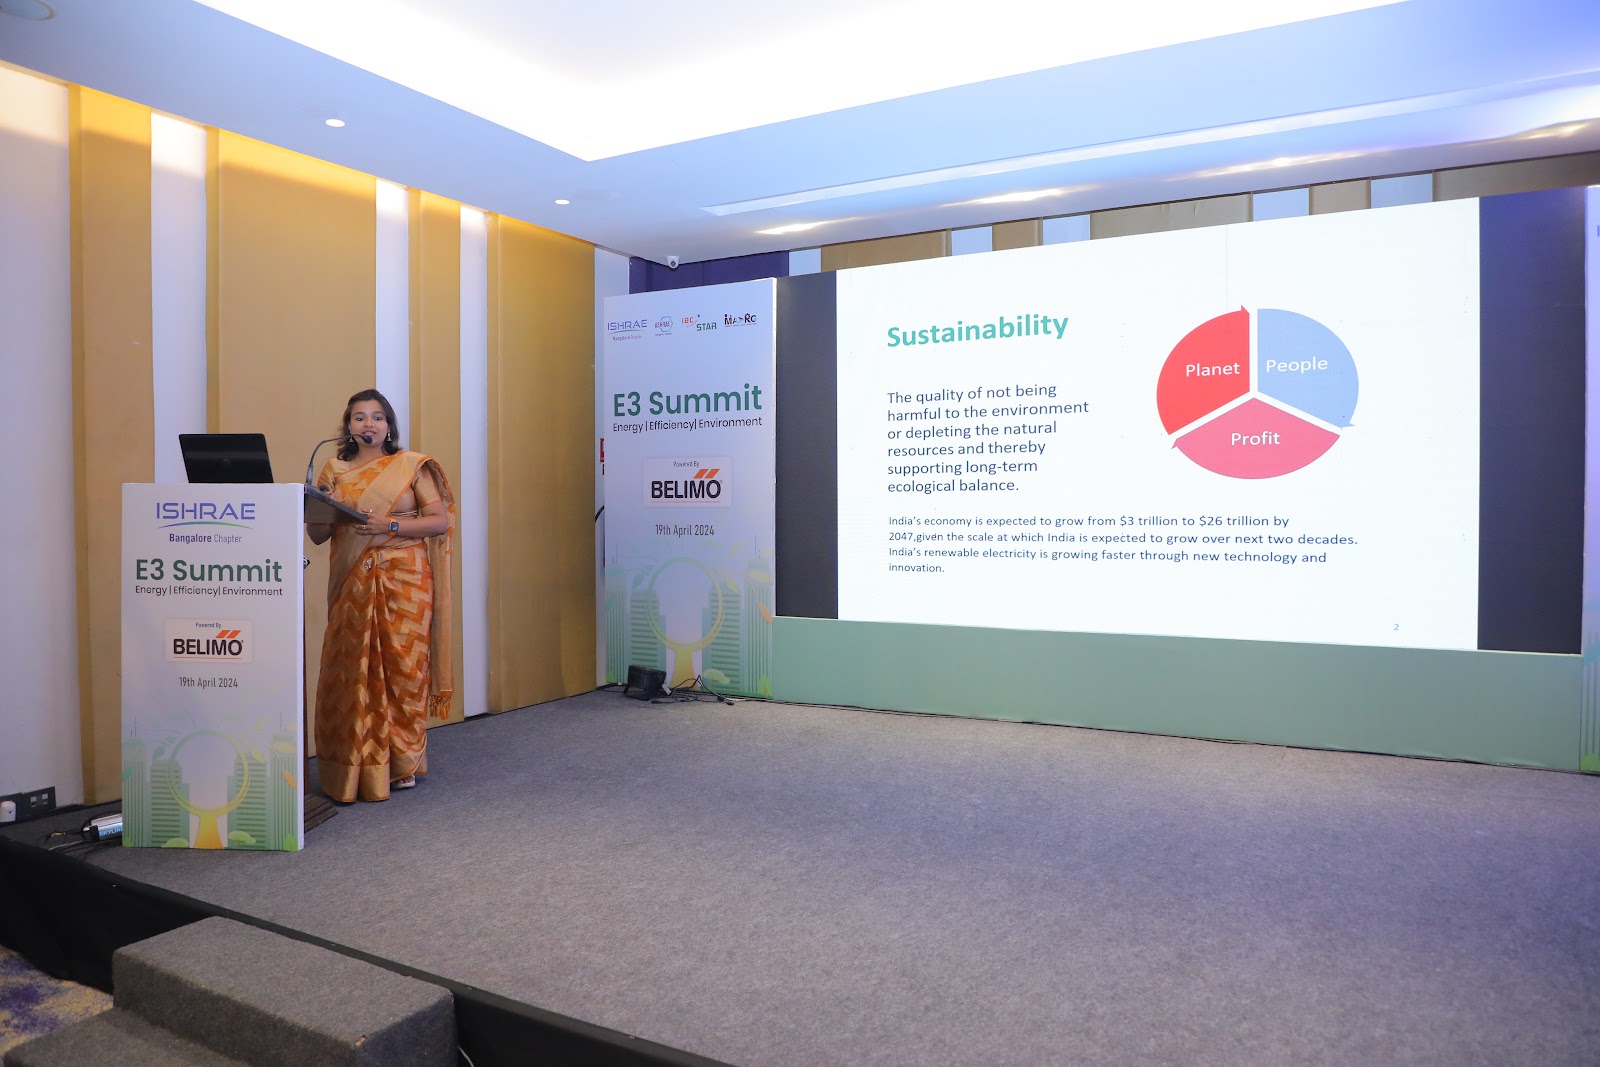
E3 summit at ISHRAE on Net Zero emissions for sustainable development

E3 summit at ISHRAE on Net Zero emissions for sustainable development